Effective Date: [April 10, 2025] Welcome to The Horizons Times By accessing or using our website https://thehorizonstimes.com , you agree to comply with and be bound by the following Terms of Use. Please read them carefully before using the Site.
1. Acceptance of Terms
By registering an account, accessing or using any part of the Site, you accept and agree to be bound by these Terms of Use and our [Privacy Policy]. If you do not agree, you should not access or use the Site.
2. Eligibility
You must be at least 16 years old to use the Site. By registering, you confirm that you meet this requirement.
3. Account Registration
You agree to provide accurate, current, and complete information during registration. You are responsible for maintaining the confidentiality of your account and password and for all activities that occur under your account.
4. Use of Content
All articles, images, videos, and other content available on the Site are protected by copyright and intellectual property laws. You may not copy, distribute, or use our content without prior written permission, except for personal, non-commercial purposes.
5. User Conduct
You agree not to:
Post or share unlawful, harmful, or offensive content.
Violate any applicable local, national, or international law.
Attempt to interfere with the Site’s operation or security.
Use bots or automated tools to collect data from the Site.
7. Termination
We reserve the right to suspend or terminate your account at any time, without notice, if you violate these Terms or if we believe your actions may harm the Site or other users.
8. Disclaimers
The Site is provided “as is” and “as available.” We do not guarantee that the Site will be uninterrupted, error-free, or secure. We disclaim all warranties, express or implied.
9. Limitation of Liability
To the fullest extent permitted by law, The Horizons Times shall not be liable for any indirect, incidental, or consequential damages arising from your use of the Site.
10. Modifications
We reserve the right to modify these Terms at any time. Changes will be effective upon posting to the Site. Continued use of the Site after changes constitutes acceptance of the updated Terms.
By clicking “I agree” or registering an account, you acknowledge that you have read, understood, and accepted these Terms of Use.
Geo-Economic Consequences of the Russia-Ukraine War (2022–2025)
Geo-Economic Consequences of the Russia-Ukraine War (2022–2025)
Russia’s full-scale invasion of Ukraine in February 2022 triggered seismic shifts in global economic relations, particularly for the United States (US) and the European Union (EU). Western allies responded with unprecedented sanctions against Russia, dramatically curtailing trade ties and disrupting long-established supply chains.
The war and sanctions regime set off spikes in energy and commodity prices, driving inflation to multi-decade highs and forcing costly government interventions to protect households. At the same time, Europe embarked on a historic pivot away from Russian oil and gas, accelerating investments in alternative suppliers and renewable energy sources.
This report provides an in-depth analysis of the geo-economic consequences of the war from 2022 through 2025, focusing on impacts on trade and supply chains, economic losses to the US and EU due to sanctions, and Europe’s energy policy shifts. We draw on official data (Eurostat, U.S. Department of Commerce, IMF, IEA, etc.) and expert commentary from economists, policymakers, and industry analysts to illustrate the profound economic realignments underway.
Impact on Trade Relations and Global Supply Chains
Collapse of EU-Russia and US-Russia Trade: The war and ensuing sanctions delivered an immediate blow to trade between Russia and Western economies. EU–Russia trade, once sizable, has shriveled to a fraction of its pre-war level.
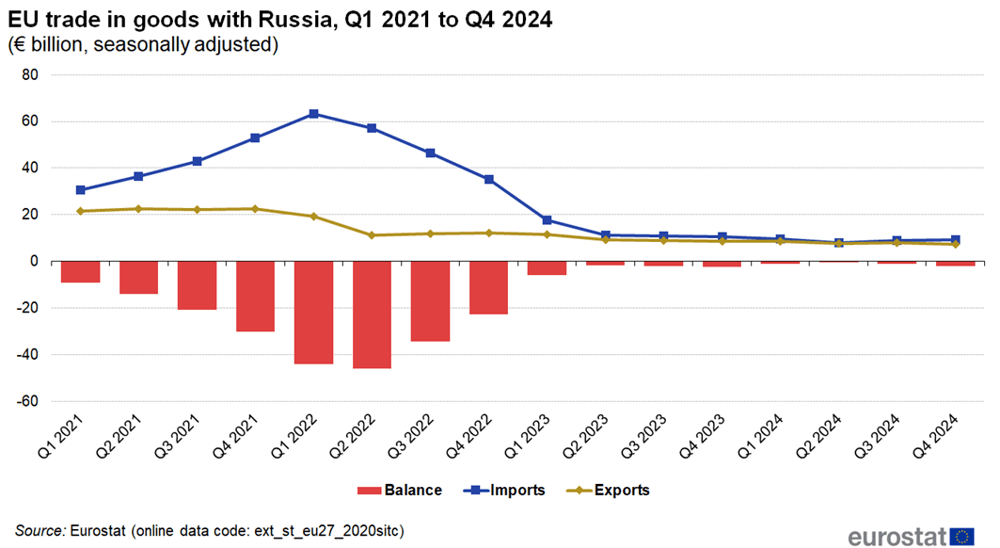
Figure 1 below shows how EU imports (blue line) from Russia plummeted after Q1 2022, while EU exports (gold line) also sharply declined . Between the first quarter of 2022 and the end of 2024, EU exports to Russia fell by 62%, and EU imports from Russia crashed by 85% . The EU’s trade deficit with Russia – swollen by high oil and gas prices in early 2022 – narrowed from a record €46.0 billion in Q2 2022 to only €2.1 billion by Q4 2024. This collapse reflects sweeping EU bans and restrictions on Russian goods (from coal and oil to iron and steel) and the exodus of Western companies from the Russian market.
Figure 1: EU trade in goods with Russia, Q1 2021–Q4 2024.EU imports from Russia (blue) and exports to Russia (gold), in € billions (seasonally adjusted). Russia’s invasion and sanctions in 2022 led to a precipitous drop in trade. By Q4 2024, Russia’s share of EU external trade had fallen to just 1.5% of imports and 1.1% of exports
The United States – which had a smaller but nontrivial trade relationship with Russia before the war – experienced a similarly dramatic cutoff. U.S. exports to Russia nose-dived as sanctions took effect, dropping about 70–80% within months of the invasion and roughly 90% by 2023 compared to 2021 levels . According to the U.S. Department of Commerce, U.S. goods exports to Russia shrank from $6.4 billion in 2021 to just $0.6 billion in 2023, while imports from Russia fell from $29.6 billion to about $4.6 billion over the same period . In other words, by 2023 the goods trade between the U.S. and Russia had effectively collapsed – a ~85% decline in total trade volume – as companies halted business and prohibited items (from advanced technology to luxury goods) could no longer be exchanged. The few remaining trade flows were primarily in unsanctioned goods (e.g. certain medical or humanitarian products). The U.S. Treasury and Commerce Department also imposed strict export controls, cutting off Russia’s access to critical semiconductors and machinery, which further curtailed trade .
Reorientation of Global Trade Flows
As the EU and US severed ties with Moscow, Russia redirected exports to willing markets in Asia, the Middle East and Africa. China, India, Turkey and others significantly increased purchases of Russian energy and commodities, partially filling the void. For example, while the EU slashed Russian oil imports, India ramped up its intake of discounted Russian crude, and China became the primary buyer of Russian pipeline gas that once flowed to Europe . This realignment of trade marks a shift toward a more fragmented global trade system, with “blocs” emerging: a Western bloc eschewing Russian resources, and others opportunistically deepening trade with Russia to capitalize on lower prices. Nonetheless, the loss of the affluent EU market has long-term implications for Russia – by 2023 Russia had fallen from the EU’s 5th largest trading partner in 2021 to 10th place or lower, and was overtaken by countries like South Korea and India in trade rankings .
Western trade realignments are also evident. European imports have been re-sourced from alternative partners. For instance, the EU replaced Russian petroleum with oil from the Middle East, the US, and Africa; Russian coal was swapped out for imports from Colombia, Australia, South Africa, and domestic sources . Perhaps most striking is Europe’s pivot on natural gas (detailed in a later section): pipeline gas from Russia that once met 40–45% of EU demand has been largely substituted by liquefied natural gas (LNG) from the United States and Qatar and by pipeline gas from Norway and North Africa . The United States similarly boosted imports from non-Russian sources (for example, buying more critical minerals from allies) and increased exports to Europe (such as LNG and refined fuels) to help offset the loss of Russian supplies.
Global Supply Chain Disruptions
The war’s outbreak in 2022 compounded pandemic-era supply chain stresses, especially in commodities. Ukraine and Russia are among the world’s top exporters of grains, vegetable oils, and fertilizers – and the invasion throttled these supplies. In the months after February 2022, global food prices surged to record highs. The United Nations Food and Agriculture Organization’s Food Price Index hit its highest level since records began in 1961 . Wheat and corn prices jumped to all-time peaks as Black Sea shipments were blocked . By March 2022, wheat was trading ~30% higher than pre-war, with developing nations that depend on affordable grain facing acute shortages . A UN-brokered deal (the Black Sea Grain Initiative) in mid-2022 allowed some Ukrainian grain exports to resume, which helped stabilize prices later in the year . Even so, food insecurity intensified in import-dependent regions of Africa and the Middle East. As one report noted, “Russia’s invasion of Ukraine… exacerbated a food crisis” by disrupting two leading global suppliers of wheat, barley, and sunflower oil . Fertilizer supply chains were also upended – Russia, a major fertilizer exporter, faced sanctions and export curbs, driving fertilizer costs sharply higher worldwide . Higher fertilizer prices, in turn, threatened agricultural yields elsewhere, illustrating the war’s cascading effects on global supply networks.
Industrial supply chains saw mixed impacts. Critical materials like palladium (Russia supplies ~37% of global palladium, used in catalytic converters) and neon gas (Ukraine was a key source for semiconductor-grade neon) experienced disruptions, forcing manufacturers to seek alternate sources. Prices for some of these inputs spiked in 2022 amid scarcity fears. However, strategic stockpiles and rapid supplier diversification (e.g. chipmakers qualifying neon supply from other countries) prevented a full-blown production crisis in sectors like electronics. Still, automotive and aerospace supply chains suffered delays – European carmakers, for example, had to halt production of certain models in spring 2022 when Ukrainian-made wire harnesses became unavailable due to the conflict . Globally, the war reinforced a trend toward “friend-shoring” or sourcing from politically allied nations. The EU, for instance, launched initiatives to secure critical raw materials and components from friendly countries to reduce vulnerability to geopolitical shocks.
Economic Losses to the US and EU from Sanctions (2022–2025)
GDP and Growth Impacts: The Russia-Ukraine war has acted as a drag on economic growth in both Europe and (to a lesser extent) the United States, though precise estimates vary. One comprehensive model-based assessment published in The World Economy found that the war represented a cost equivalent to ~1% of global GDP in 2022 (about $1.5 trillion) compared to pre-war projections . Europe absorbed the largest hit: by end-2022, European GDP was ~1% lower than it would have been without the war, with major economies like Germany, France, and Italy among the worst affected . This lost output stemmed from surging energy prices, disrupted trade, and dented consumer and business confidence. In fact, the EU’s growth forecasts were repeatedly downgraded – the European Commission’s Winter 2022 forecast (pre-invasion) of ~4% GDP growth was slashed to under 3% by summer 2022 after the war began ([PDF] How bad is the Ukraine war for the European recovery?). While the EU ultimately avoided a deep recession in 2022–23, growth virtually stalled in late 2022 and early 2023 (the eurozone grew only about 0.5% in 2023). The US economy, being less dependent on Russian trade, fared better but still saw growth tempered by the inflationary shock and tighter monetary policy that followed. The US real GDP contracted slightly in Q1/Q2 2022 (a technical recession) and full-year 2022 growth slowed to ~2.1%, about 1 percentage point lower than pre-war trend forecasts (partly due to war-induced inflation prompting aggressive interest rate hikes by the Federal Reserve).
Inflation Surge and Consumer Hardship: A salient “cost” of the war for the West has been the aggravation of inflation. By mid-2022, energy and food prices – driven upward by the conflict – had pushed inflation to levels not seen in decades. In the euro area, inflation peaked at 10.6% in October 2022, the highest since the euro’s creation . Many EU member states saw even more dramatic spikes (e.g. the Baltic countries endured >20% inflation in late 2022). Food prices in the EU climbed ~20% year-on-year by early 2023, squeezing household budgets. As the European Central Bank noted, this inflation surge eroded real incomes significantly, effectively acting like “a tax,” with poorer households hit the hardest as essentials became more expensive . The United States similarly saw a 40-year inflation high of 9.1% in June 2022, driven in part by $5+ per gallon gasoline and expensive groceries following the war’s supply shock. Though inflation has since moderated on both sides of the Atlantic (falling into the 3–5% range by late 2023), the cumulative loss of purchasing power for consumers in 2022–2023 was significant – a direct economic cost attributable to the conflict’s disruptions.
Fiscal Costs and Corporate Losses: To cushion the blow to consumers and businesses, European governments intervened on a massive scale – incurring substantial fiscal costs. From September 2021 through early 2023, EU countries collectively earmarked €681 billion (and the UK an additional €103 billion) to shield households and firms from soaring gas and electricity bills . This €784 billion energy aid (nearly 5% of EU GDP) aimed to cap prices, provide rebates, or temporarily nationalize energy firms in distress. By February 2023, Europe’s energy crisis spending had nearly matched the €750 billion COVID recovery fund in scale. Major economies bore the brunt: Germany alone committed about €270 billion, France and Italy around €150 billion each . These emergency outlays, funded by borrowing, are an indirect economic cost of the war, contributing to higher public debt and deficits. In the US, the federal government did not implement broad energy price controls, but it did release strategic oil reserves (a 180-million-barrel drawdown) to lower gasoline prices – effectively selling a national asset to mitigate war-induced price spikes. Moreover, the US approved over $113 billion in aid to Ukraine in 2022–2023 (military and economic assistance), which while not a “loss” to the economy per se, is a fiscal expenditure that some critics juxtapose against domestic needs.
Western corporations also incurred notable losses due to sanctions and the decision to exit Russia. More than 1,000 multinational companies withdrew from Russia, often writing off assets and investments. European banks with Russian exposure took write-downs, energy giants like BP and Shell wrote off a combined $40–50 billion on Russian joint ventures and oil/gas fields , and industrial manufacturers from Germany to the US shuttered Russian factories at their own expense. These one-time corporate losses (e.g. BP’s $25 billion write-off of its stake in Rosneft ) hit shareholder value and, in some cases, workers (through layoffs), translating into an economic cost of the private-sector response to sanctions. Insurance and reinsurance companies faced claims related to political risk policies. Meanwhile, secondary effects of sanctions – such as higher input costs – hurt industries in Europe. For example, Russia was a major source of cheap aluminum, nickel, and titanium for European manufacturers; replacing these with costlier sources raised production costs for carmakers and aerospace firms. Certain EU industries curtailed production in late 2022: EU metals and chemical output fell as record gas/electricity prices made operations unprofitable (e.g. zinc smelters and fertilizer plants idled). This “wartime deindustrialization” fear was voiced by some analysts who warned that Europe might see emissions drop “for the wrong reasons – through recession and industrial output cuts rather than a smooth green transition” . Indeed, Europe’s industrial heartlands (Germany, in particular) narrowly avoided a severe contraction, thanks in part to government support and a milder winter, but not without scars in energy-intensive sectors.
Diverse Expert Perspectives on Sanctions: Economists continue to debate the overall impact of the sanctions on Western economies. On one hand, many argue the costs, while significant, were a price worth paying to counter Russia’s aggression. EU leaders frequently underscore the strategic rationale: European Commission President Ursula von der Leyen in mid-2022 acknowledged higher energy costs at home but maintained that sanctions are “weakening Russia’s economic base” and that Europe “must stay the course” to uphold international law. This view is shared by policymakers who point out that Russia’s GDP is now 10–12% below pre-war trends and its budget is strained, indicating sanctions have worked as intended . From this perspective, the economic pain in the West, while real, is manageable and far smaller as a share of GDP than the hit to Russia (whose economy contracted by ~2.1% in 2022 and is expected to stagnate in 2023–25). Moreover, some experts highlight long-term benefits arising from the crisis: greater energy independence, more resilient supply chains, and accelerated innovation (discussed more in the next section).
On the other hand, some economists and industry voices caution about the ongoing toll. For instance, Hungary’s Prime Minister Viktor Orban (a dissenting voice within the EU) claimed in 2022 that “sanctions are hurting Europe more than Russia,” citing the spike in European gas prices and inflation – though most EU leaders disputed this narrative. Independent analysts note that Europe’s competitiveness could suffer if energy prices remain structurally higher than in Asia or the US. The Economics Observatory reported that by 2023, Western Europe’s growth lagged behind other regions, partly due to the energy shock, and raised questions about how long European public support for sanctions can endure if the war drags on . Still, the consensus among Western economists is that while sanctions did contribute to short-term economic pain (especially in 2022), the worst has been mitigated by adaptive policies, and the EU and US economies have proven resilient – avoiding the doomsday scenarios (like a complete gas cutoff-induced depression in Europe) that some feared in early days of the war .
Shifts in EU Energy Policy: Independence from Russia and Renewables Boost
Perhaps the most dramatic geo-economic shift spurred by the war has been Europe’s energy divorce from Russia. Prior to 2022, the EU relied on Russia for roughly 40% of its natural gas, 27% of its oil, and 46% of its coal – a decades-long dependence that Moscow had leveraged for political influence. In the span of months, that dependence has been drastically unwound. Europe not only replaced Russian fossil fuels with alternative suppliers, but also doubled down on energy efficiency and renewable energy to reduce overall reliance on imports. This section details how the war catalyzed a new EU energy strategy, encapsulated in the European Commission’s REPowerEU plan, and the implications for the US and global energy landscape.
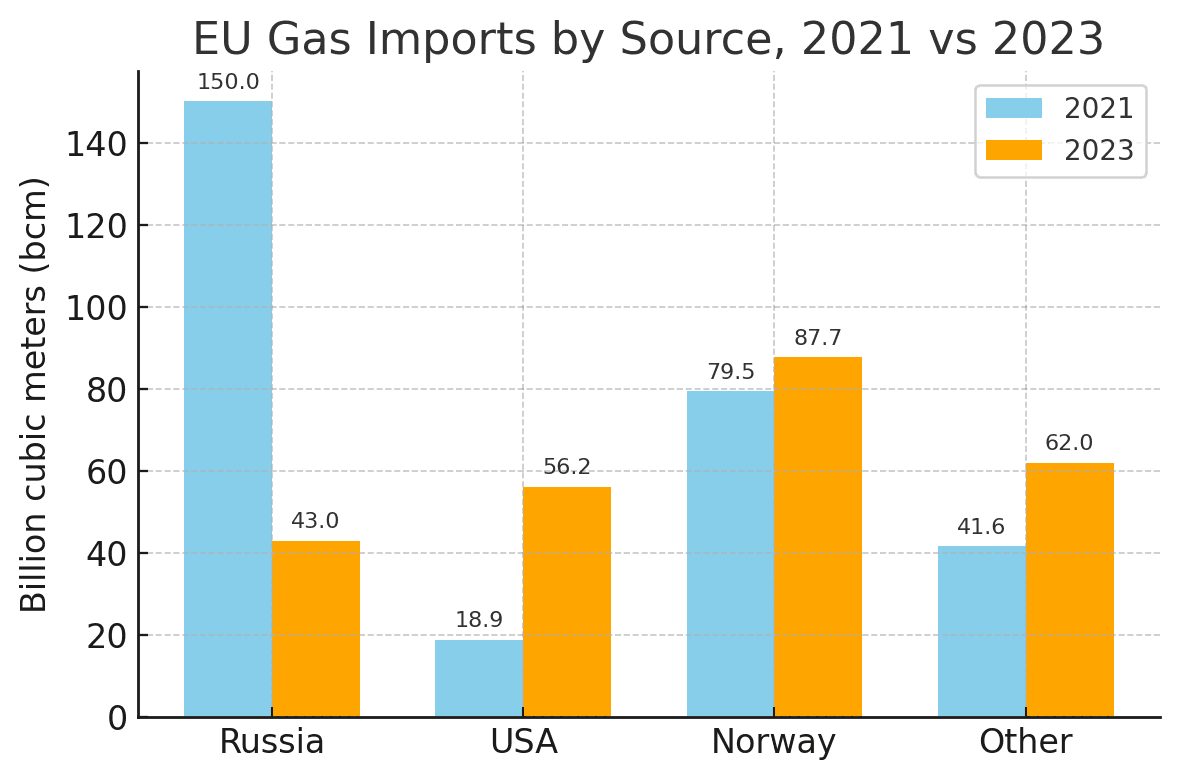
Cutting the Cord on Russian Fossil Fuels: The EU moved with startling speed to sanction and phase out Russian energy. By August 2022, the EU had banned Russian coal imports entirely. In December 2022 and early 2023, it imposed an embargo on seaborne imports of Russian crude oil and refined petroleum products, respectively (with limited exceptions for pipeline oil to certain landlocked members) . Russia’s pipeline gas, while not legally banned, was largely cut off in practice – Gazprom sharply reduced flows through 2022 (culminating in the Nord Stream pipeline sabotage in September). As a result, Russian pipeline gas deliveries to the EU fell to a trickle by 2023. Official EU data shows that Russia’s share of EU natural gas imports plummeted from ~45% in 2021 to only 15% by 2023. Looking just at pipeline gas, the drop was even starker: from over 40% of EU supply in 2021 to about 8% in 2023. In volume terms, the EU imported over 150 billion cubic meters (bcm) of Russian gas in 2021, but under 43 bcm in 2023 – a reduction of more than 70% (Figure 2). Russian oil imports to Europe saw a similarly steep decline: Russia had been supplying ~25% of EU oil imports, but by late 2023 that share fell to single digits (Russian crude is effectively absent from Western Europe’s refineries, aside from a few pipelines to Eastern Europe) . These steps mark a historic unwinding of energy ties – a deliberate “decoupling” from a supplier that had been deeply embedded in Europe’s energy system.
Figure 2: EU Gas Imports by Source, 2021 vs 2023.Russia’s pipeline gas exports to the EU have been largely replaced by other sources. In 2021, Russia supplied ~150 bcm of gas to the EU (blue bar, left), but in 2023 this fell below 43 bcm (orange bar). In contrast, LNG and pipeline imports from the United States jumped from 18.9 bcm to 56.2 bcm, Norway increased from 79.5 to 87.7 bcm, and imports from Other partners (e.g. Qatar, North Africa, UK) rose from 41.6 to 62 bcm. Russia (once Europe’s top gas supplier) has been overtaken by Norway and the US
To accomplish this rapid shift, Europe undertook a two-pronged approach: (1) Demand reduction – conserving energy to use less gas – and (2) Supply diversification – finding new suppliers and fuels. On the demand side, EU governments and citizens cut gas consumption by over 13% in 2022 (EU gas use fell from ~402 bcm in 2021 to ~350 bcm in 2022) . This was achieved via mild winter weather, efficiency measures, fuel switching, and even emergency plans for industry curtailments. For example, thermostats were turned down, and some factories shifted to running on oil or biomass instead of gas. The effort paid off: Europe made it through the 2022/23 winter without energy rationing, a scenario that seemed plausible when Russian flows first halted. On the supply side, the EU lined up alternative gas sources at an unprecedented pace. Liquefied natural gas (LNG) imports surged – Europe imported over 120 bcm of LNG in 2023, up 60+% from pre-war levels . The United States emerged as Europe’s single largest LNG provider, supplying almost half of EU LNG imports in 2023 as volumes from the US nearly tripled compared to 2021 . This reflects a deepening transatlantic energy partnership: American LNG exporters sent record cargoes to Europe, benefiting from high prices, while Europe rapidly built new LNG import terminals (Germany chartered floating LNG terminals and built its first-ever import facilities in a matter of months in late 2022). Traditional pipeline suppliers also stepped up – Norway increased gas exports to cover roughly 30% of EU demand in 2023 (87.8 bcm) , making Norway Europe’s top gas supplier now. North African countries (Algeria, Egypt, Libya) boosted pipeline and LNG deliveries to account for ~14% of EU gas supply . Even imports from global LNG markets like Qatar, Nigeria, and Trinidad grew to fill the gap . Through this diversification, by 2024 the EU had effectively weaned itself off Russian gas: Moscow’s combined share (pipeline + LNG) in EU gas imports fell below 15%, down from ~50% before . This dramatic reorientation in less than two years has been called a geopolitical “energy divorce”.
Energy Price and Policy Impacts
Initially, cutting out the world’s major energy exporter caused substantial price pain – European natural gas prices (TTF) spiked above €200/MWh in mid-2022 (equivalent to an unheard-of ~$60 per million Btu) – roughly 10 times their pre-war norm. Oil prices too surged above $120 per barrel in spring 2022. These price shocks prompted the government subsidies described earlier, but they also had a market effect: high prices curtailed demand and attracted supply. By mid-2023, European gas prices had fallen back below €40/MWh, and oil prices eased into the $70–90 range, in part because Europe successfully secured enough alternative energy. Policymakers also implemented structural market reforms: the EU set up a joint gas purchasing platform to negotiate as a bloc for LNG, began imposing price caps on gas trades under extreme conditions, and adjusted power market rules to decouple electricity prices from gas costs . All these steps, while complex, aimed to enhance energy security and affordability in a post-Russia context. By early 2024, EU gas storage was comfortably above historical averages (e.g. ~95% full heading into winter 2023/24) (REPowerEU), a far cry from the anxious scramble of 2022. This transition was so swift that the IEA’s Executive Director Fatih Birol remarked that few would have expected Europe “to replace Russian gas at this scale and speed” – calling it an example of energy resilience under pressure.
Accelerated Renewable Energy Transition: Importantly, the crisis did not just reshuffle fossil fuel suppliers; it gave a powerful boost to Europe’s long-term shift toward clean energy. Reducing reliance on an adversarial supplier reinforced the strategic value of domestically produced renewable energy. As one energy analyst observed, “Russia’s invasion… forced Europe to speed up the energy transition”, uniting environmental and security goals). The EU’s REPowerEU plan, unveiled in 2022, set ambitious new targets: it called for 45% of EU energy to come from renewables by 2030 (up from a 32% target pre-war) and for installing vast amounts of new wind and solar capacity as quickly as possible . Progress has been striking. In 2022, for the first time ever, the EU generated more electricity from renewables than from gas . By 2023, renewables (wind, solar, hydro, biomass) accounted for 46% of EU electricity generation. EU countries set records for renewable deployment: since 2022, the EU installed nearly 96 GW of new solar PV capacity and 33 GW of wind . To put that in perspective, 96 GW of solar is about the output of 100+ typical nuclear reactors, and it represents doubling the EU’s solar generation since 2019 . Reports by energy think tanks E3G and Ember found that from March to September 2022, EU solar and wind output jumped 13% year-on-year, saving an estimated 8 billion cubic meters of gas (worth $11 billion) during that period alone by displacing gas-fired power . Over the full year, Ember estimated that higher wind and solar generation in 2022 saved Europe from having to import roughly 70 bcm of gas, avoiding about $99 billion in fuel costs – a remarkable economic buffer created by renewables. An industry expert noted, “The war had two effects: It accelerated the deployment of [renewable] projects already in the pipeline, and led to increased ambition by member states… for the coming years,” highlighting how policy and investment plans were ramped up).
Massive investment is flowing into clean energy as a result. In 2023, EU countries invested around €110 billion in renewable energy projects, the highest ever annual investment . This includes everything from utility-scale wind farms in the North Sea to rooftop solar programs in Poland. The European Investment Bank and other institutions are mobilizing hundreds of billions in green financing. The EU also rolled out the Green Deal Industrial Plan in 2023, aiming to scale up domestic cleantech manufacturing (solar panels, batteries, heat pumps, etc.) so that Europe’s push for renewables does not simply translate into new import dependencies . In effect, the war has accelerated Europe’s timeline for decarbonization: what might have been a more gradual energy transition got a wartime stimulus. Artur Patuleia, a clean energy analyst, observed that the crisis “increased [renewable] ambition by member states” and fast-tracked projects that previously faced bureaucratic delays . Governments have been cutting red tape for renewable permits and upping renewable targets – for example, Germany raised its 2030 renewable electricity target to 80% of supply (from 65% pre-war) and passed laws to speed up wind farm approvals, explicitly linking these moves to the need to replace Russian gas.
That said, the short-term energy mix adjustment was not without setbacks for climate goals. In the immediate crunch of 2022, some countries burned more coal temporarily to make up for gas shortages – e.g. coal-fired generation in the EU rose about 7% in 2022 (an increase of ~15 TWh) . Germany and Austria reopened a few coal plants from reserve, and the Netherlands lifted caps on coal use. These were seen as temporary emergency measures. Indeed, as renewables surged and gas supply stabilized, EU coal power fell again in 2023. Another side effect: nuclear power output dropped in 2022 (by ~119 TWh in the EU) due to unexpected outages in France and plant closures, which ironically made the energy crunch worse – however, France has since worked to bring reactors back online, and some countries (like Belgium) delayed nuclear phase-outs in response to the crisis. By 2024, Europe’s power sector emissions were on a downward trajectory again as clean energy scaled up and coal use receded. The International Energy Agency (IEA) concluded that “the Ukraine war likely accelerated the clean energy transition” in Europe, by reinforcing the economic and strategic case for renewables. In sum, Europe’s energy policy has pivoted towards security through diversity and sustainability: diversification of suppliers in the near term, and diversification of energy sources (fossil to renewable) in the long term. This pivot is one of the most significant geo-economic consequences of the war, as it is reshaping energy markets and investment flows globally.
The United States, for its part, benefitted from Europe’s energy shift in certain ways (becoming a top LNG exporter) but also faces new dynamics. US LNG exporters enjoyed a windfall as European demand drove up prices – American LNG shipments to the EU more than doubled from 2021 to 2022, and the US accounted for ~50% of EU LNG imports in 2023 . This solidified the US’s role as an energy supplier to Europe, strengthening transatlantic economic ties. At the same time, the US is racing the EU (and China) in a clean tech investment boom, spurred by the Inflation Reduction Act’s $369 billion in climate funding. Competition and cooperation in clean energy tech will be a defining feature of the post-war geo-economic landscape.
Global effect and final assessment
From 2022 to 2025, the Russia-Ukraine war has reverberated through the economies of the United States and European Union, catalyzing both disruptive losses and transformative changes. In the immediate term, the war dismantled trade relationships with Russia that had been built over decades – EU-Russia and US-Russia commerce has all but collapsed, forcing companies to sever ties and rewrite supply chains. This decoupling contributed to a global supply shock that sent prices of energy and food soaring in 2022, fueling inflation and testing social stability. The US and Europe bore significant costs: higher living expenses for households, billions in government spending to blunt the energy crisis, and a drag on economic growth amounting to perhaps 1% of GDP or more .These are the tangible geo-economic consequences of confronting Russian aggression through sanctions. And yet, by 2023 a remarkable adaptation was underway. Western economies showed resilience – inflation has been brought down from peak levels, new suppliers have replaced banned Russian goods, and worst-case recessions were avoided.
In Europe especially, the war has been a wake-up call that led to historic strategy shifts, particularly in energy. The EU has demonstrated that it could pivot away from Russian energy dependence far faster than many thought possible: Russian gas now makes up only a sliver of Europe’s imports, and OPEC, the US, and others have supplanted Russian oil in EU refineries . The short-term pain of this pivot has been real – epitomized by soaring energy bills in 2022 – but the longer-term payoff is a more secure and independent European energy system. At the same time, the crisis injected new urgency into the green transition, arguably accelerating global decarbonization efforts. As noted by energy economists, Europe’s response has “cemented [its] commitment to carbon pricing and renewables”, marrying climate goals with security goals . This could have spillover benefits in terms of technological innovation and reduced emissions in the years ahead.
For the United States, the geo-economic impact has been mixed but significant. Trade sanctions on Russia had a small direct effect on the vast US economy, but the war’s indirect effects – higher inflation and interest rates – were a headwind in 2022. US consumers felt the bite of $5 gasoline, and the Federal Reserve’s rapid rate hikes (partly a reaction to commodity-driven inflation) slowed interest-sensitive sectors. However, US energy producers gained a major new market in Europe, and US geopolitical leadership in coordinating sanctions and supplying energy strengthened transatlantic ties. The EU’s sourcing of LNG from America is a new feature of the bilateral economic relationship that is likely to endure, to mutual benefit.
Going forward, experts suggest the war has ushered in a more fragmented but also more resilient geo-economic order. Western economies have learned to reduce exposure to a hostile power, even at an initial cost, and in doing so have built new partnerships (e.g. EU-Norway, EU-US in energy) and invested in future-proofing their supply chains. Policymakers in the EU and US are now far more attuned to the geopolitics of trade and investment – whether that means screening foreign investments, onshoring critical industries, or forging “friend-shoring” networks for resources and components. As economist Kenneth Rogoff observed, the war has likely accelerated de-globalization trends that were already in motion, putting national security considerations at the forefront of economic policy.
In summary, the Russia-Ukraine war’s geo-economic fallout for the US and EU has been profound. The allies absorbed short-term economic losses – in trade, growth and price stability – but have emerged by 2024 with a reconfigured economic landscape: one less entangled with Russia, more invested in secure and sustainable sources, and arguably more unified in purpose. “We will never again be vulnerable to energy blackmail,” declared one EU official, reflecting a widely held view in Europe that the costs endured have bought a safer future. Whether these adjustments prove to be net positive (through enhanced energy security and innovation) or if enduring challenges (like higher baseline energy costs or competitive disadvantages) linger, will unfold in the coming years. What is certain is that the war has indelibly altered the geo-economic map – redrawing trade routes, rewriting energy strategies, and reinforcing the nexus between economics and geopolitics for both the European Union and the United States.
Sources: Official trade and economic data from Eurostat, U.S. Census Bureau, USTR, Eurostat Statistics Explained, and EU Commission reports were used, alongside analyses by the IMF, World Bank, IEA, and think-tanks (Bruegel, PIIE, E3G/Ember). Key references include Eurostat’s report on the collapse of EU–Russia trade (, U.S. Department of Commerce figures on U.S.–Russia trade , Reuters and FAO data on energy and food price impacts , and European Commission/Consilium data on the EU’s energy diversification and renewables rollout . These illustrate the quantitative scope of changes between the pre-war period and 2022–2025. Expert commentary from economists and industry analysts was also included to provide context and diverse perspectives on these developments . The combination of official statistics and expert analysis paints a comprehensive picture of the geo-economic consequences of the Russia-Ukraine war for the US and EU.


Leave a Comment